def f(x):
"""
A cool function that multiples an input x by 2.
"""
return 2*x
y = f(3)
print(y)6
Harlin
December 24, 2022
How to create technical posts that include Python code, explanatory text, and notes.
Your posts should be placed in the posts/ directory of your website.
If you want to make a new page called puppycat, then create a new folder named puppycat/ inside posts/. For example:
posts
└───composing
└───puppycat < new folder
└───quarto
└───software
└───welcome
You have two options with the folder puppycat/.
index.ipynbSince your homework posts will be based on previous work you did in a Jupyter notebook or Google colab, this will probably be the easier option for publishing homeworks.
index.qmd text fileBut this is probably a better option for your group project blog post, and once you (hopefully) continue to build up your portfolio using this website.
For either options, make sure to add a header that looks like this to the top:
---
title: "Creating posts"
author: "Harlin"
date: "2022-12-24"
categories: [week 0, example]
---
In Jupyter notebook, this header should be in a raw cell up top.
You can use Markdown to style basic text, much as you do in Jupyter Notebooks.
Look into Quarto’s Markdown basics, Figures and Tables. You’re welcome to explore other pages that cover more complex concepts like Diagrams, Videos, and Callout Blocks.
If you are familiar with the \[\LaTeX\] typesetting system, you can use many standard commands by enclosing them in double $ symbols. You can make both inline math like \[f(x) = e^x\] and display math like
\[\sum_{i = 1}^{\infty} \frac{1}{i^2} = \frac{\pi^2}{6}.\]
You can and should include images in your posts, especially in cases where you have created a data visualization. If the image is already available online, you can link to it using the syntax :
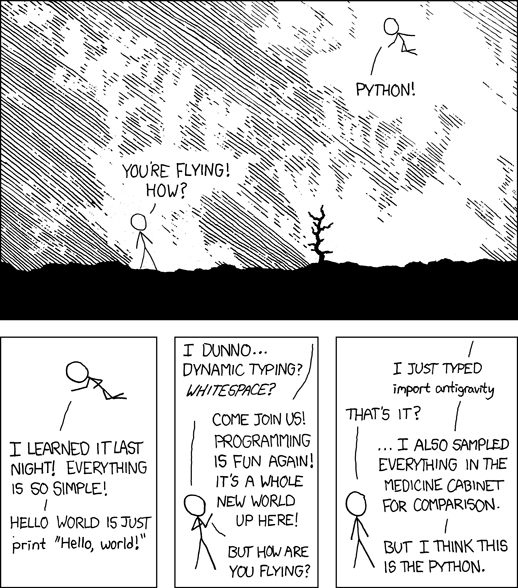
(Source: https://xkcd.com/353/)
There are two main ways to insert code in your posts. When talking about a short concept, like the np.random.rand() function, you can type back ticks like this: `np.random.rand()`.
To create a larger block of code, use three consecutive backticks ``` to both open and close the code block. If you place the word “{python}” immediately after the opening code blocks, you’ll get attractive syntax highlighting:
Not only that, once you render the page with Quarto, the code output will show up below. If that’s not what you want, use the word “python” instead of “{python}”
Look at this other cool example from the Quarto tutorial.
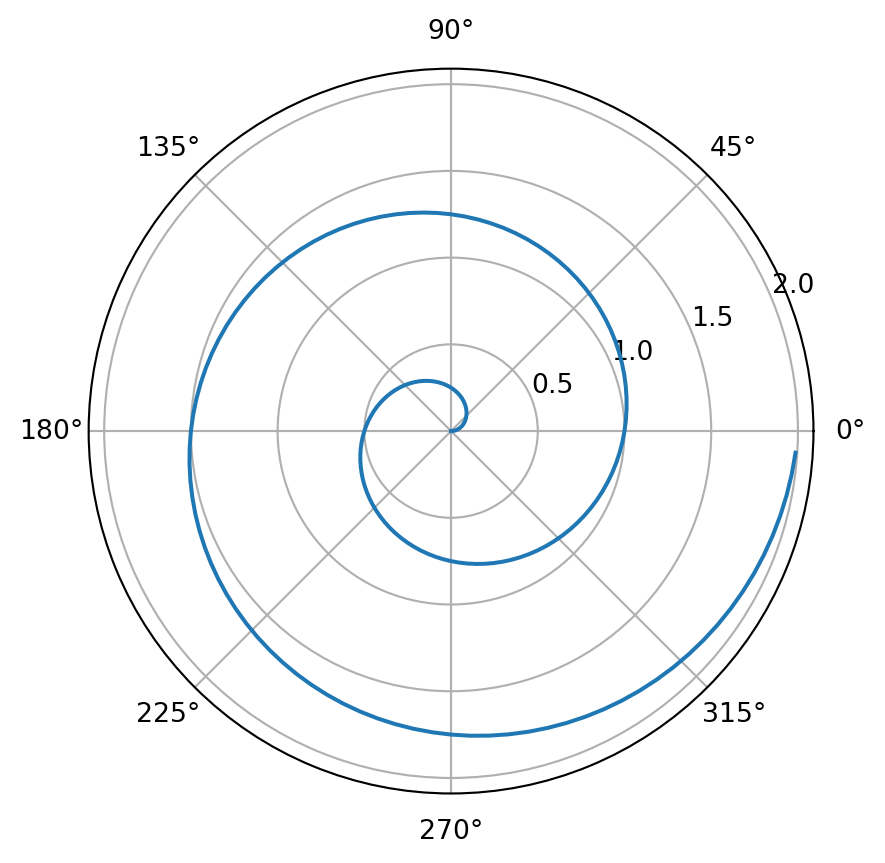
For a demonstration of a line plot on a polar axis, see Figure 1.
---
title: "Creating posts"
author: "Harlin"
date: "2022-12-24"
categories: [week 0]
image: index_files/figure-html/fig-polar-output-1.png
format:
html:
code-fold: false
code-tools: true
jupyter: python3
---
How to create technical posts that include Python code, explanatory text, and notes.
# Directory
Your posts should be placed in the `posts/` directory of your website.
If you want to make a new page called `puppycat`, then create a new *folder* named `puppycat/` inside `posts/`. For example:
```
posts
└───composing
└───puppycat < new folder
└───quarto
└───software
└───welcome
```
# Create the File
You have two options with the folder `puppycat/`.
- Option 1: Add a Jupyter Notebook named `index.ipynb`
Since your homework posts will be based on previous work you did in a Jupyter notebook or Google colab, this will probably be the easier option for publishing homeworks.
- Option 2: Add a `index.qmd` text file
But this is probably a better option for your group project blog post, and once you (hopefully) continue to build up your portfolio using this website.
For either options, make sure to add a header that looks like this to the top:
```
---
title: "Creating posts"
author: "Harlin"
date: "2022-12-24"
categories: [week 0, example]
---
```
In Jupyter notebook, this header should be in a `raw` cell up top.
## Markdown Styling
You can use Markdown to style basic text, much as you do in Jupyter Notebooks.
Look into Quarto's [Markdown basics](https://quarto.org/docs/authoring/markdown-basics.html), [Figures](https://quarto.org/docs/authoring/figures.html) and [Tables](https://quarto.org/docs/authoring/tables.html). You're welcome to explore other pages that cover more complex concepts like [Diagrams](https://quarto.org/docs/authoring/diagrams.html), [Videos](https://quarto.org/docs/authoring/videos.html), and [Callout Blocks](https://quarto.org/docs/authoring/callouts.html).
## Math
If you are familiar with the $$\LaTeX$$ typesetting system, you can use many standard commands by enclosing them in double \$ symbols. You can make both inline math like $$f(x) = e^x$$ and display math like
$$\sum_{i = 1}^{\infty} \frac{1}{i^2} = \frac{\pi^2}{6}.$$
## Images
You can and should include images in your posts, especially in cases where you have created a data visualization. If the image is already available online, you can link to it using the syntax ``:

(Source: [https://xkcd.com/353/](https://xkcd.com/353/))
## Code
There are two main ways to insert code in your posts. When talking about a short concept, like the `np.random.rand()` function, you can type back ticks like this: \`np.random.rand()\`.
To create a larger block of code, use three consecutive backticks \``` to both open and close the code block. If you place the word "{python}" immediately after the opening code blocks, you'll get attractive syntax highlighting:
```{python}
def f(x):
"""
A cool function that multiples an input x by 2.
"""
return 2*x
y = f(3)
print(y)
```
Not only that, once you **render** the page with Quarto, the code output will show up below. If that's not what you want, use the word "python" instead of "{python}"
Look at this other cool example from [the Quarto tutorial](https://quarto.org/docs/get-started/hello/jupyter.html).
For a demonstration of a line plot on a polar axis, see @fig-polar.
```{python}
#| label: fig-polar
#| fig-cap: "A line plot on a polar axis"
import numpy as np
import matplotlib.pyplot as plt
r = np.arange(0, 2, 0.01)
theta = 2 * np.pi * r
fig, ax = plt.subplots(
subplot_kw = {'projection': 'polar'}
)
ax.plot(theta, r)
ax.set_rticks([0.5, 1, 1.5, 2])
ax.grid(True)
plt.show()
```